-
Products
- Gas analysis systems
- GAOS SENSON gas analyzers
- GAOS MS process mass spectrometry
- MaOS HiSpec ion mobility spectrometer
- MaOS AxiSpec ion mobility spectrometer
- Applications
- News
- Events
- About us
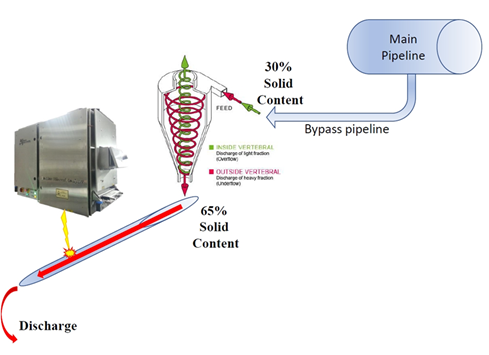
For measurement, the industrial hydrocyclone was used to increase the solid content from 30% up to 60-65%. The LIOS OnLine system was installed after the hydrocyclone directly over an unpressurized half-pipe, allowing receiving the chemical analysis of slurry in real-time.
The samples taking during the calibration process have the following chemical composition as per laboratory XRF results:
|
Analyzed Parameter |
Minimum, % |
Maximum, % |
|
SiO2 |
0.3 |
1.0 |
|
Fe2O3 |
0.1 |
0.3 |
|
Al2O3 |
0.009 |
0.25 |
|
CaCO3 |
94 |
97 |
|
MgCO3 |
2 |
5 |
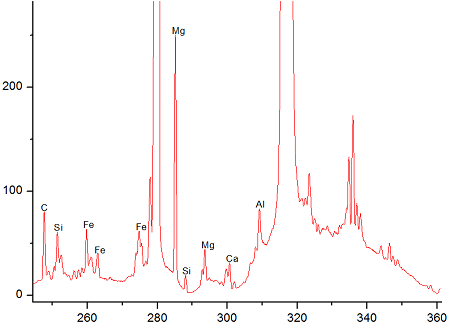
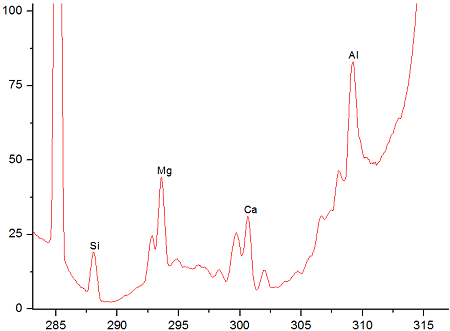
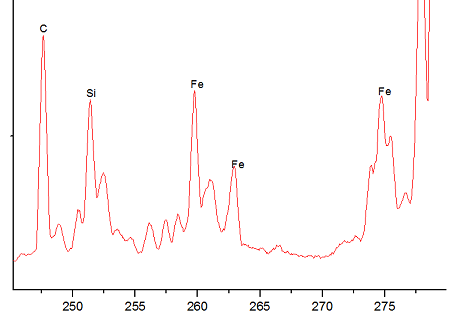
The experiments were conducted using the LIOS OnLine analysis system based on LIBS and equipped with two lasers of 100 mJ energy each. Spectral data was received using spectrometers with the following ranges: λ = 244-360 nm. These ranges were chosen as most suitable for elements of interest.
Comparing XRF and LIBS analysis, errors derived from sampling, splitting and lab analytical error should be taken into the consideration.
 |
 |
 |
 |
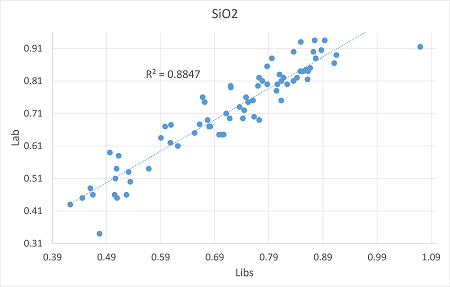
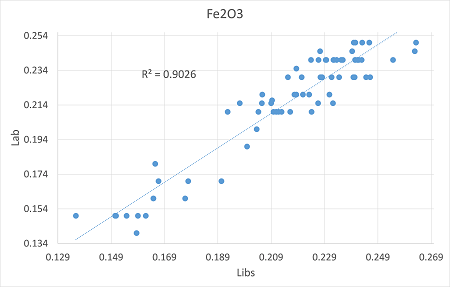
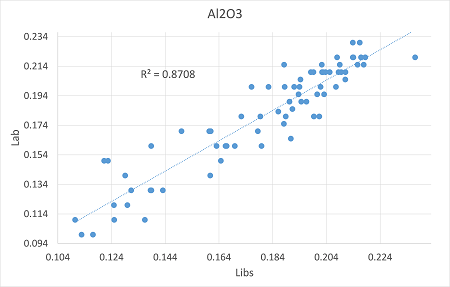
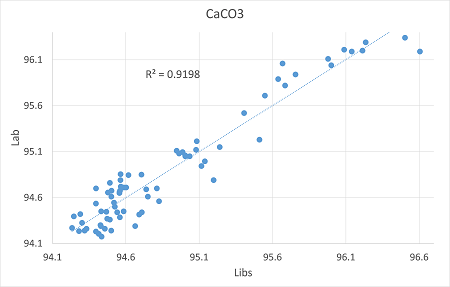
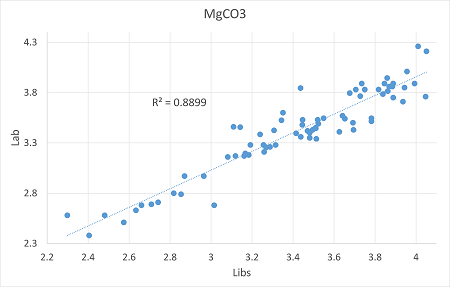
According to chemical data of the samples "Lab vs LIBS" calibration curves were calculated. "Lab" refers to the chemical data, while "LIBS" to the laser analysis.
 |
 |
 |
 |
 |
|
|
Analyzed Parameter |
R2 |
Average error |
RMSE |
|
Fe2O3 |
0.9 |
0.008 |
0.010 |
|
Al2O3 |
0.87 |
0.01 |
0.013 |
|
SiO2 |
0.88 |
0.037 |
0.049 |
|
CaCO3 |
0.92 |
0.149 |
0.177 |
|
MgCO3 |
0.89 |
0.104 |
0.143 |
In addition to LIBS analysis, the accuracy calculation also includes an error, derived from sampling, splitting and lab analytical error.
Implementation of online LIBS analysis will allow controlling the product quality in real-time, every several minutes and not once in several hours.