-
Products
- Gas analysis systems
- GAOS SENSON gas analyzers
- GAOS MS process mass spectrometry
- MaOS HiSpec ion mobility spectrometer
- MaOS AxiSpec ion mobility spectrometer
- Applications
- News
- Events
- About us
|
|
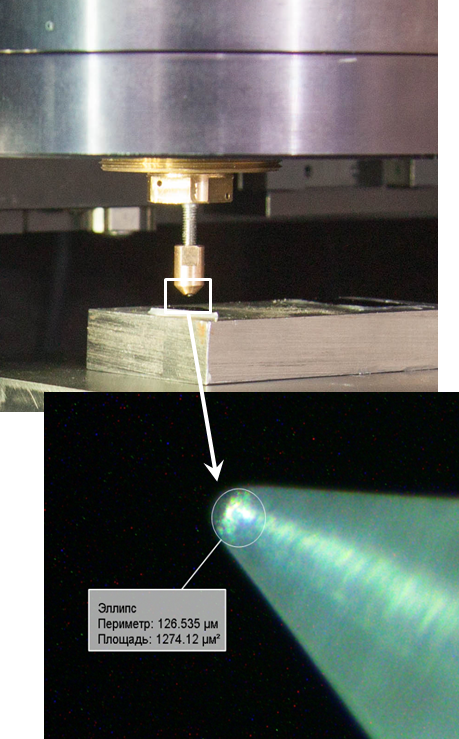
| Indenter positioning – displacement between microscope focus point and indenter tip is calibrated with 1 um accuracy |
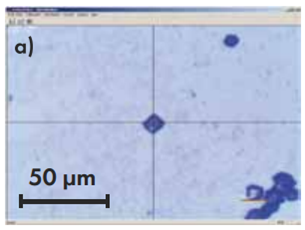
| Measuring linear size (and area) over the optical image |
|
|
|
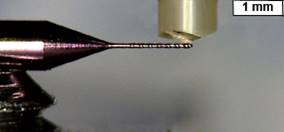
Sample: micro-drill for electronics industry applications |
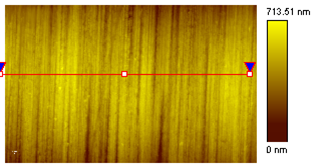
Ra = 70 nm RMS = 86 nm Rz = 232 nm H = 30,8±6,5 GPa E = 675±105 GPa k = 2,15±0,05 kN/m |
|
||
|
  |
|
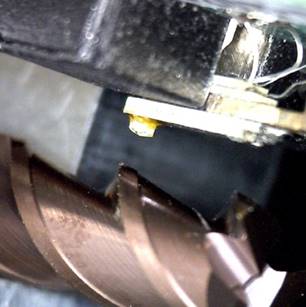
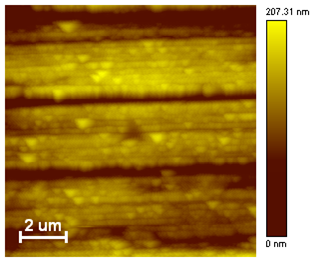
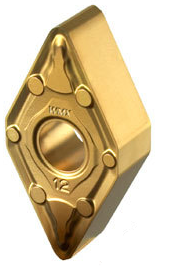
| Sample: cutting edge of the fraise | Surface topography | Image of the residual imprint |
|
|
|
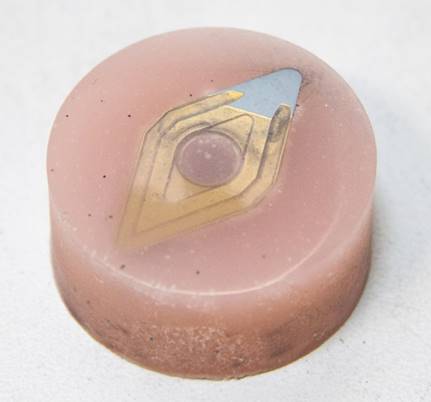
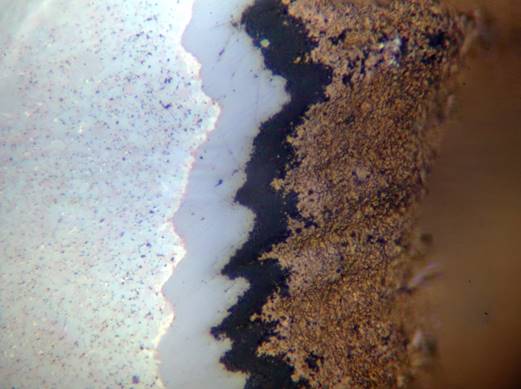
| Sample | Sample angle polish | Optical image of layered structure |
|
Material |
Hardness, GPa |
Elastic modulus, GPa |
|
Hard Alloy |
19.0 ± 5.4 |
410 ± 140 |
|
TiCN |
17.7 ± 4.5 |
340 ± 80 |
|
Al2O3 |
20.4 ± 4.0 |
340 ± 35 |
|
TiN |
10.9 ± 3.3 |
360 ± 200 |
|
|
|
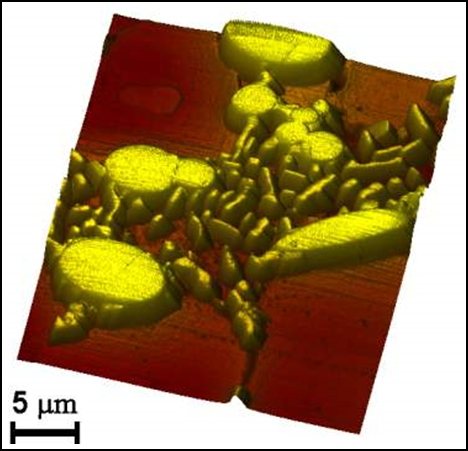
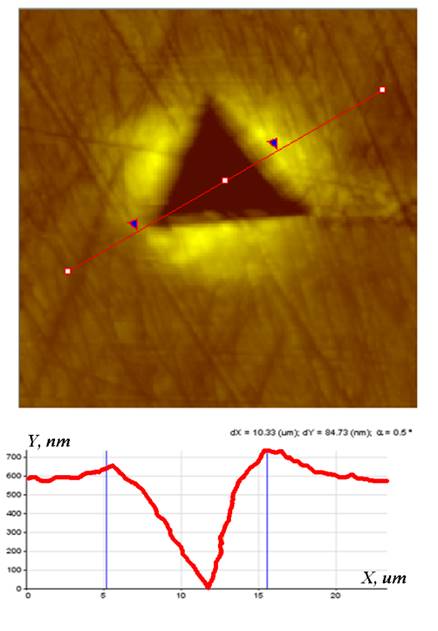
Topography: before indentation |
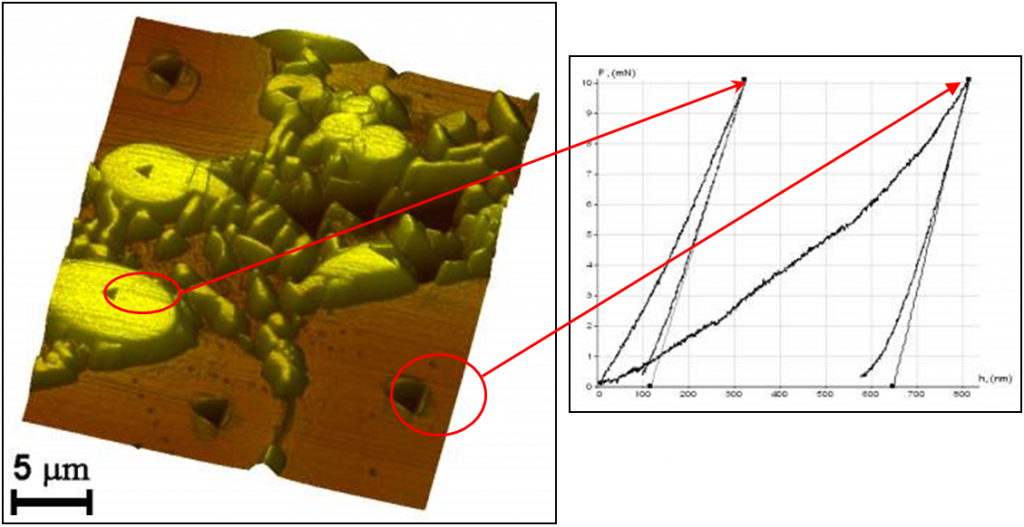
Topography: after indentation |
|

|
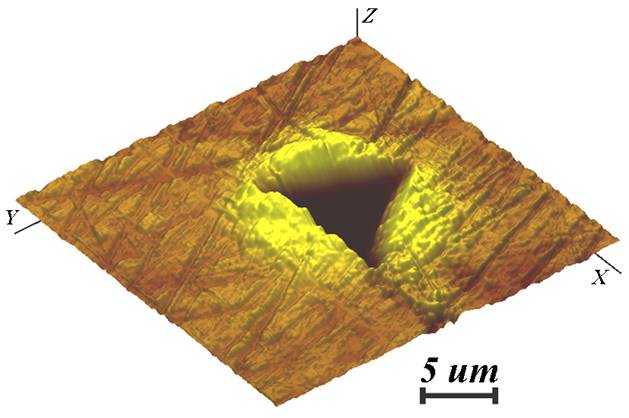
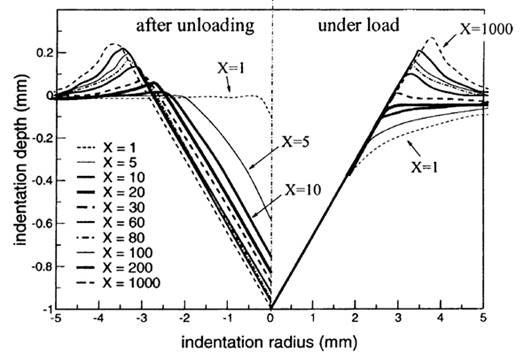
Pile-up analysis on steel 254 reference block HV 0.05 |
|
X – rheological factor E – Young’s modulus ρ0 – yield stress θ – semi-apical angle of indenter |
|
1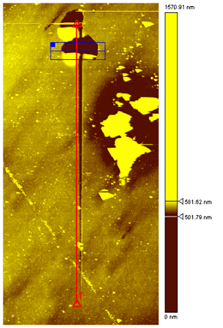
|
2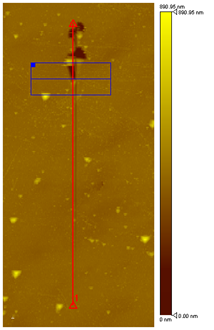
|
3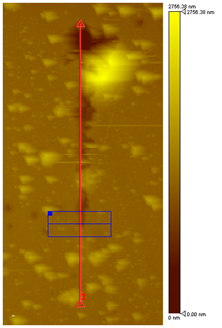
|
4
|
|
|
|
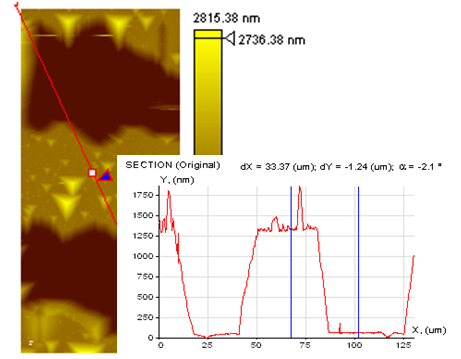
|
|
|
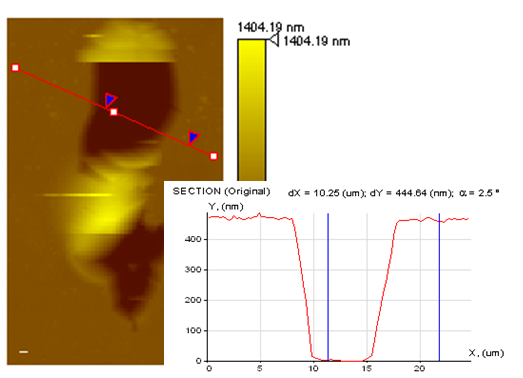
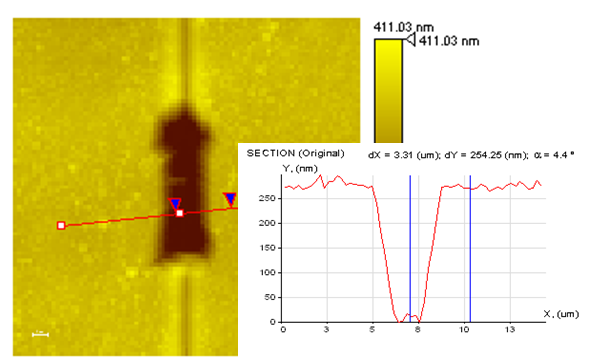
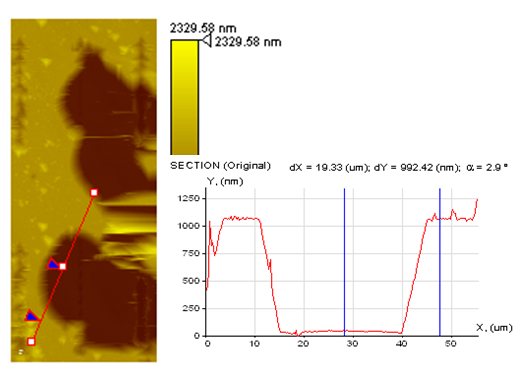
Thickness, nm |
Load at which film is pulled, mN |
|
1 |
460 ± 20 |
6,2 ± 0,3 |
|
2 |
265 ± 10 |
5,9 ± 0,3 |
|
3 |
960 ± 70 |
11,0 ± 2,6 |
|
4 |
1255 ± 20 |
20,8 ± 6 |
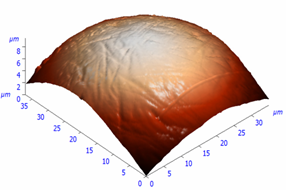
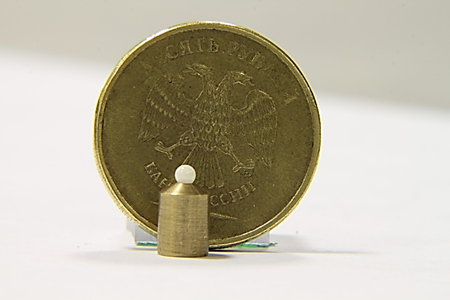 Spherical Al2O3 tip Spherical Al2O3 tip
|
|
|
|
|
|
|
Sample |
∆h, nm |
|
Duralumin (untreated) |
75 ± 15 |
|
Duralumin with protective mineral coating |
5.9 ± 1.2 |
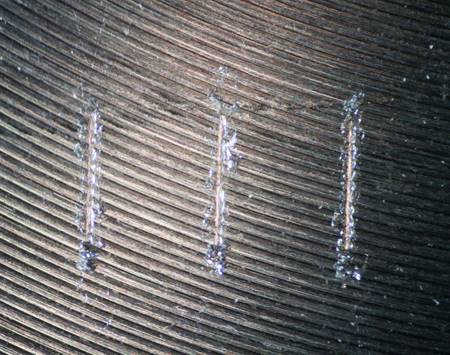
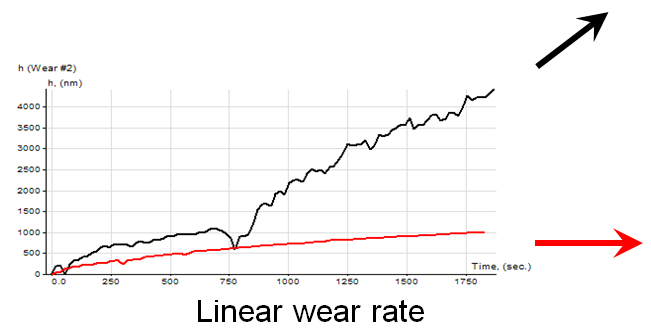
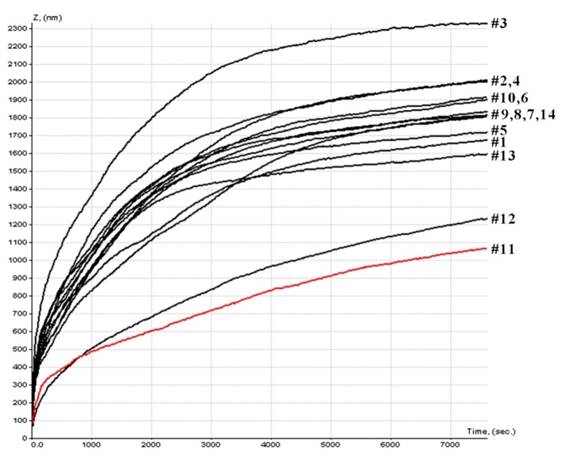
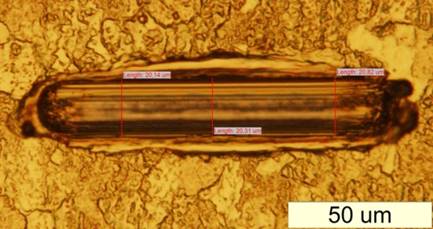
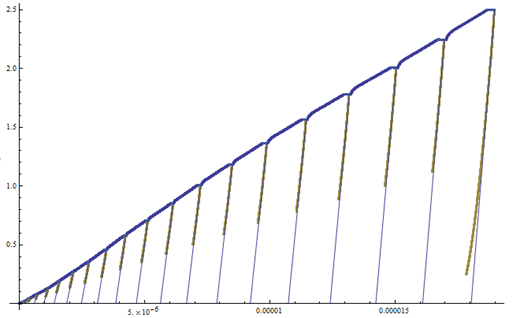
| Wear time diagram | Indirect volume estimation over the optical micro-photograph of the groove |
|
|
 |
|
| J = (L×t×ν)/h |
R=17 um — effective stylus radius; w — width of the residual groove; L=100 um — groove length; |
|
L=100 um — stroke length;
ν=0,13 Hz — reciprocating test frequency; t=7600 sec — testing time; h — indentor penetration depth; |
Direct volume estimation over the SPM image |
|
|
Experimental |
|
||
|
Chemical element |
Cr |
Ni |
Si |
Mn |
C |
V |
Fe |
|
Contents, % |
16,5 |
7,5 |
0,48 |
1,0 |
0,08 |
0,04 |
remains |
|
|
|
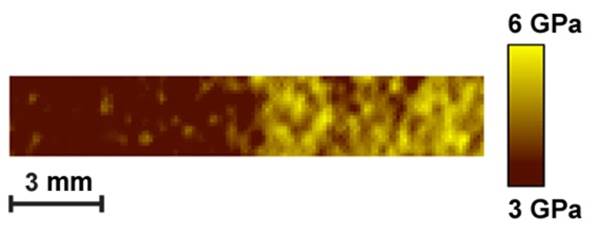
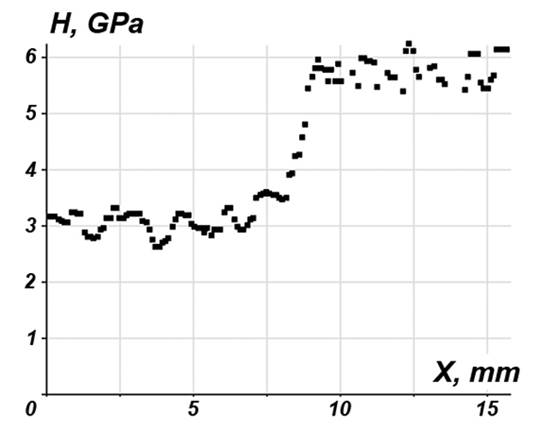
Hardness map of the magnetic zone boundary |
|
| Hardness profile across the magnetic zone boundary |
|
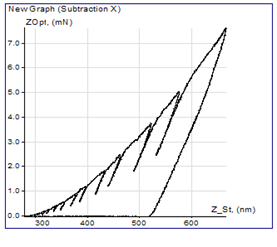
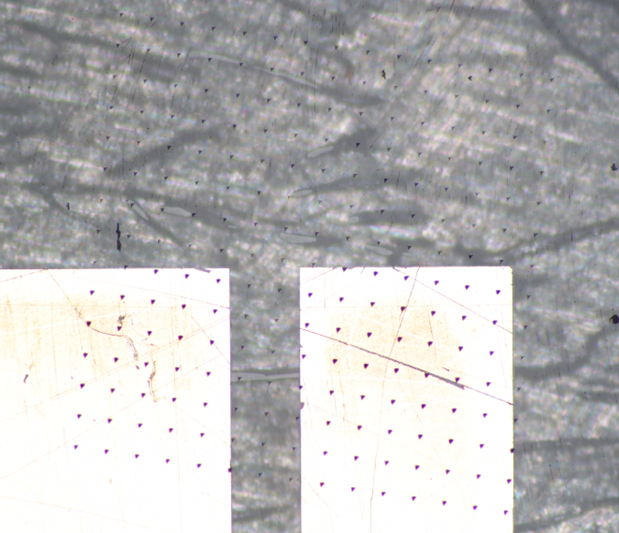
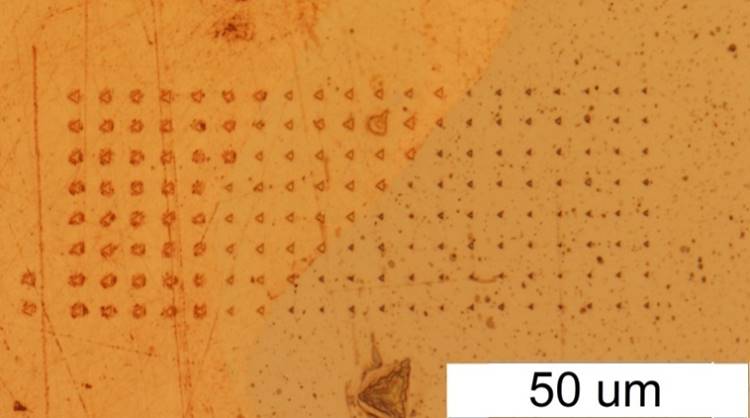
Volumetric quantitative map Optical micro-photo of the array of PUL indentations |
|
|
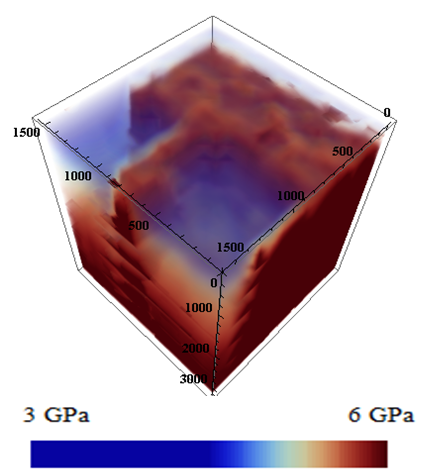
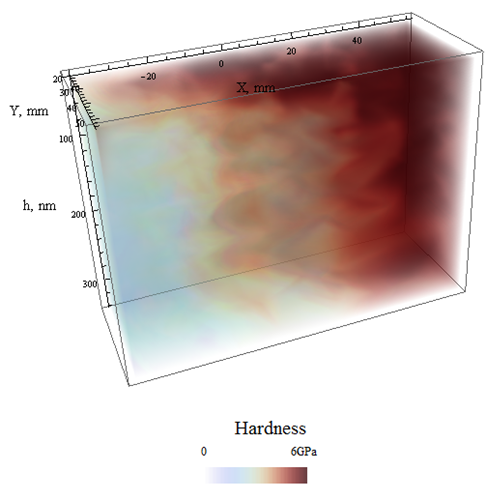
Volumetric quantitative map (tomogram) of hardness |
|
|
|
|
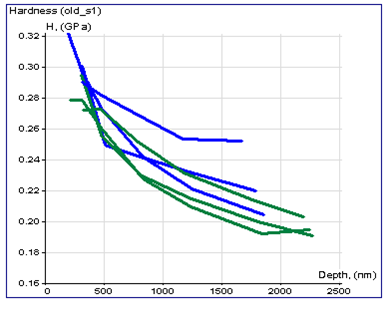
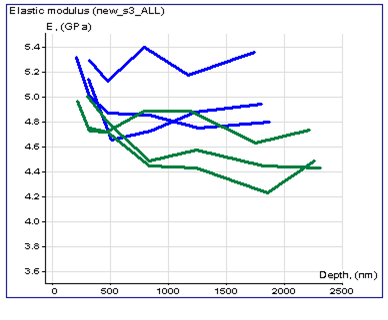
It has been shown that chemical treatment reduces hardness and elastic modulus for 10-15% Blue lines – before treatment Green lines – after treatment |
|
|
|
|
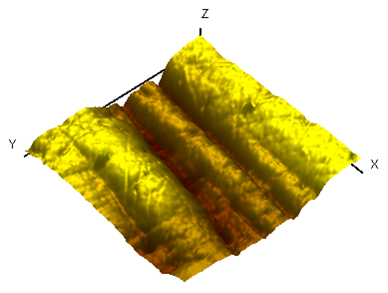
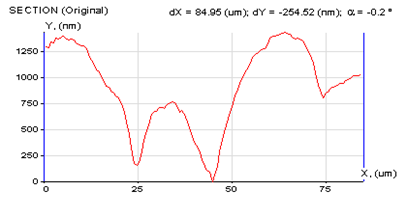
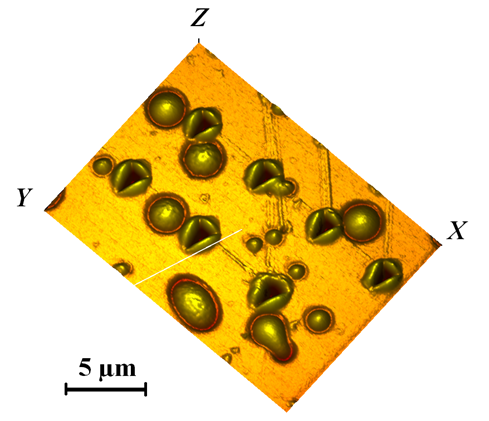
| Surface topography and cross-section profile | Hardness vs. depth dependency for 3 polymer samples | Elastic modulus vs. depth dependency for 3 polymer samples |
|

|
||||||

|
|||||||
| This polymer exhibits the properties of superabsorbent and is used in pharmaceutical industry during remedies extraction. |

|
||||||
|
Height profile of the pNIPAm film. Pile up effect depends on applied forces (F) and film thickness (h): a) F=5mN, h=5µm; b) F=1mN, h=100nm; c) F=2mN, h=100nm. |
| Profile, hardness, elastic properties testing |
|
|||||||||||||||||||||
 |
||||||||||||||||||||||
|
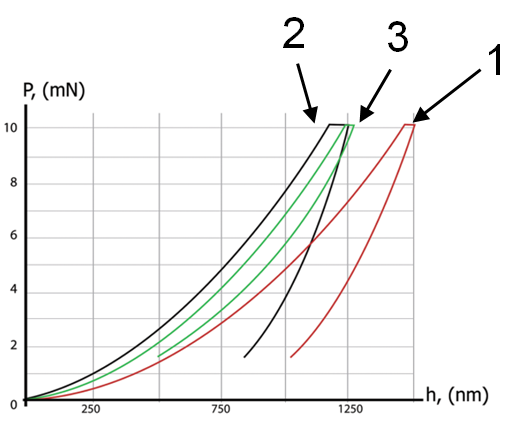
Polycarbonate (1) |
Polymethylmethacrylate (2) | Polycarbonate + coating (3) | Instrumented indentation loading-unloading curves | |||||||||||||||||||
|
||||||||||||||||||||||
|
||||||||||||||||||||||
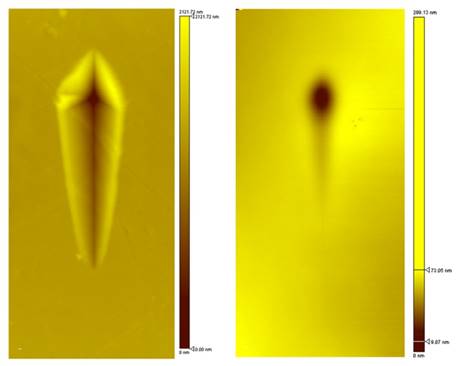
| Topography image after progressive scratch test (0 to 30 mN): PC (a) and PC+coating (b) | ||||||||||||||||||||||
|
|
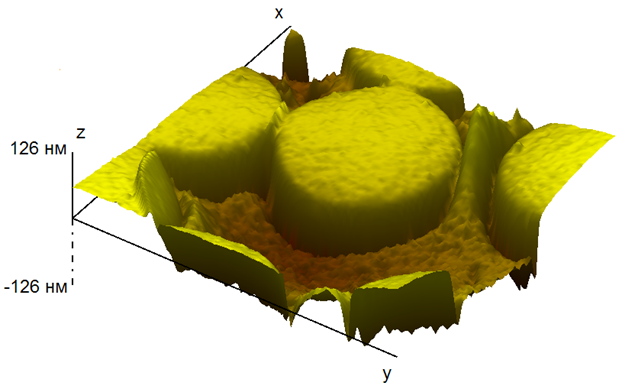
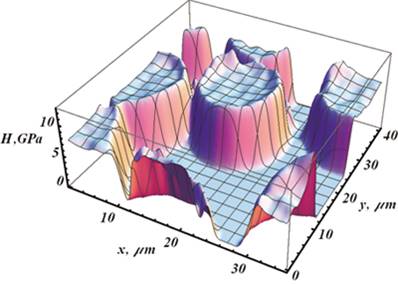
| Surface topography | Hardness map |

|
F - load force, |

|
|
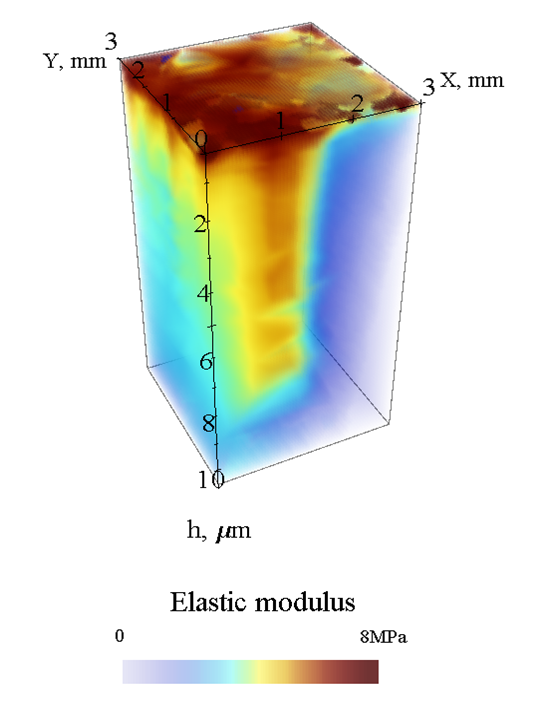
| Hardness tomography technique is based on combination of PUL or DMA method with precise indentor positioning over the regular XY grid on the sample surface |
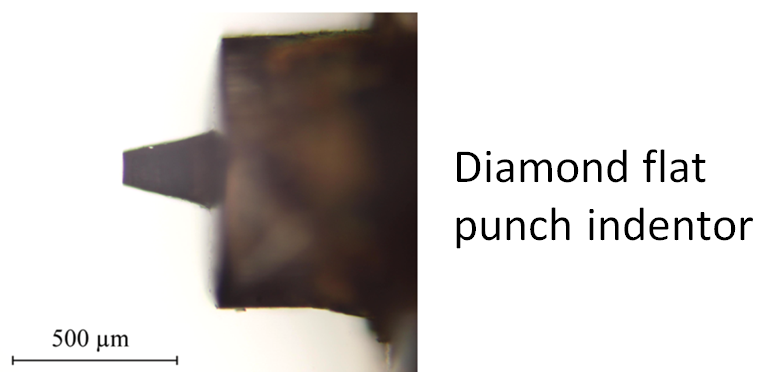
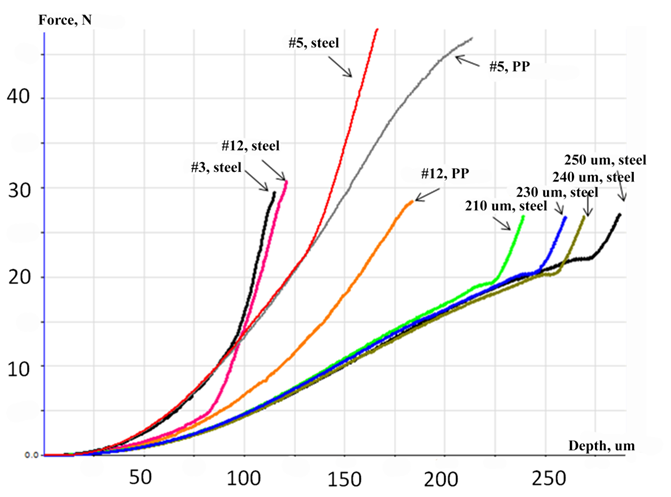
substrates of polypropylene and steel
|
|
|
|
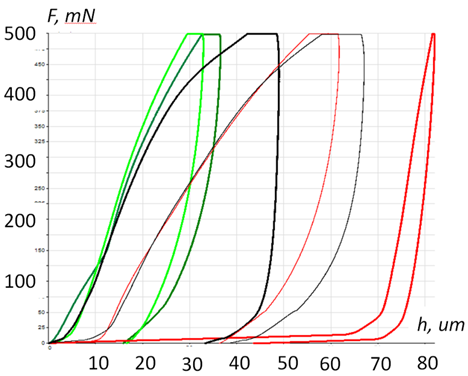
| Loading-unloading curves obtained with Berkovich diamond indentor | Loading curves during puncture test with flat punch indentor showing comparison of mechanical strength of polymer films |