-
Products
- Gas analysis systems
- GAOS SENSON gas analyzers
- GAOS MS process mass spectrometry
- MaOS HiSpec ion mobility spectrometer
- MaOS AxiSpec ion mobility spectrometer
- Applications
- News
- Events
- About us

NIOS Nanoscan scanning nanohardness tester works on the principles of scanning force microscopy. The main difference between this device and classical scanning probe microscopes (SPM) is the use of a piezoresonance cantilever tuning fork design with high bending stiffness of the console. Using the resonance mode allows you to control the surface–probe tip contact by two ways: change the amplitude and frequency of the probe. The probe resonant mode provides high amplitude and frequency stability of oscillations and guarantees a fairly soft contact of the tip with the solid material surface during scanning. At the same time, the high bending stiffness of the probe console allows the probe tip to penetrate through the viscous layer until it comes into contact with the elastic surface, and also modify the surface — indentation and scratching (sclerometry). The probe design allows the use of diamond tips of various types and sizes. The bend of the piezoresonance probe is monitored using a high-precision displacement sensor, which allows measuring the loading force during the nanoindentation process. The listed features significantly distinguish NIOS Nanoscan from other commercial devices. In particular, NIOS Nanoscan is capable of carrying out a controlled force effect on the structures under investigation ranging from several micronewtons to hundreds of millinewtons, which is hundreds of times higher than the capabilities of other SPMs. Not inferior to classical nanoindenters in measuring hardness and elastic modulus, NIOS Nanoscan significantly surpasses them in the quality of the surface images of the material being studied during scanning.
The relief and mechanical properties of the cutting tools were studied by scanning probe microscopy (SPM), nanoindentation, and sclerometry using NIOS Nanoscan scanning nanohardness tester.


The surface relief was measured using a NIOS Nanoscan scanning nanohardness tester in the mode of semi-contact scanning probe microscopy (see Appendix 1).
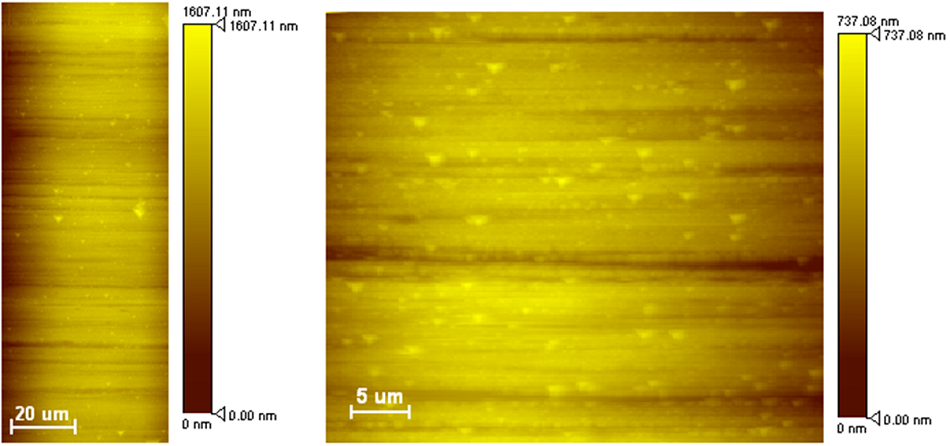
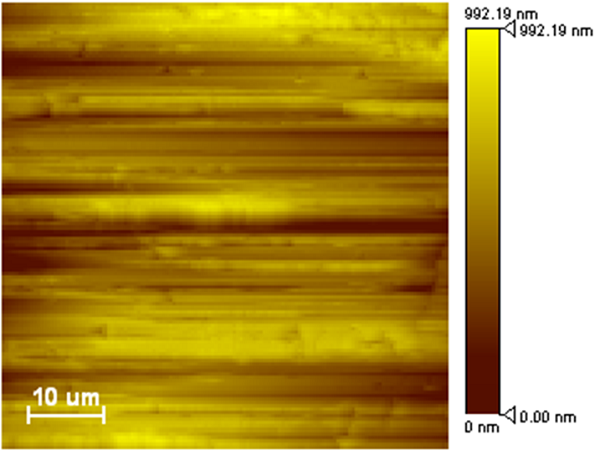
Table 1. Sample #1. Surface roughness
|
Roughness parameter |
Area with film |
Area without film |
|
Ra, nm |
70 |
120 |
|
Rms, nm |
86 |
146 |
|
Rz, nm |
232 |
294 |
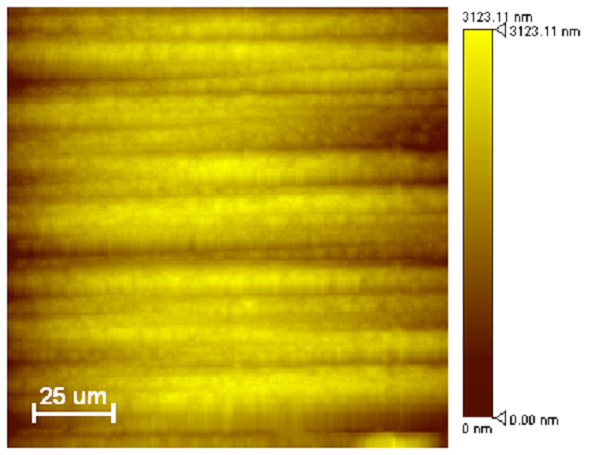
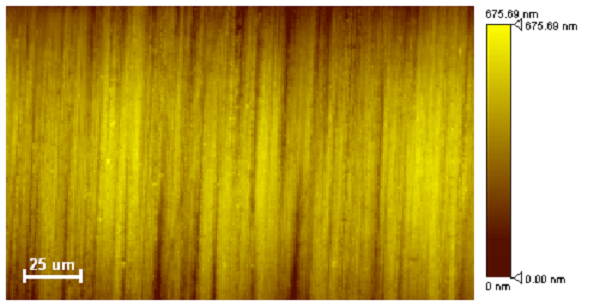
Table 2. Sample #2. Surface roughness
|
Roughness parameter |
Area with film |
Area without film |
|
Ra, nm |
265 |
40 |
|
Rms, nm |
345 |
52 |
|
Rz, nm |
785 |
156 |
The hardness and elasticity modulus was measured using a NIOS Nanoscan scanning nanohardness tester by the measuring indentation method in accordance with the recommendations of the international standard ISO 14577 (see Appendix 2).
Table 3. Sample #1. Measurement of hardness and elasticity modulus of a sample areas with film
|
Measurement Series No. |
Max. depth, nm |
Load, mN |
Hardness, GPa |
Elasticity modulus, GPa |
|
1 |
68 (8.2%) |
5 (0.2%) |
36.4 (19.5%) |
594.8 (14.5%) |
|
2 |
106 (9.0%) |
10 (0.1%) |
31.7 (22.2%) |
663.1 (20.2%) |
|
3 |
183 (10.2%) |
20 (0.1%) |
23.0 (20.8%) |
704.8 (7.8%) |
|
4 |
211 (4.9%) |
30 (0.0%) |
26.1 (11.5%) |
754.5 (11.4%) |
Elasticity modulus: 675 ± 105 GPa (15.8%)
Table 4. Sample #1. Measurement of hardness and elasticity modulus of a sample areas without film
|
Measurement Series No. |
Max. depth, nm |
Load, mN |
Hardness, GPa |
Elasticity modulus, GPa |
|
1 |
138 (12.7%) |
5 (0.3%) |
8.1 (19.3%) |
380.9 (18.3%) |
|
2 |
185 (7.6%) |
10 (0.1%) |
9.6 (10.4%) |
395.3 (9.2%) |
|
3 |
278 (1.5%) |
15 (0.0%) |
6.2 (2.0%) |
482.3 (10.2%) |
|
4 |
312 (25.3%) |
19.3 (5.0%) |
7.6 (47.4%) |
451.6 (17.9%) |
|
5 |
334 (14.4%) |
21.9 (8.9%) |
7.5 (40.3%) |
442.7 (27.5%) |
Elasticity modulus: 420 ± 65 GPa (15.5%)
Hardness: 8.2 ± 2.0 GPa (24.8 %)
Table 5. Sample #2. Measurement of hardness and elasticity modulus of a sample areas with film
|
Measurement Series No. |
Max. depth, nm |
Load, mN |
Hardness, GPa |
Elasticity modulus, GPa |
|
1 |
95 (7.3%) |
5 (0.3%) |
19.1 (24.2%) |
180 (9.6%) |
|
2 |
140 (5.3%) |
10 (0.1%) |
17.3 (4.5%) |
210 (11.2%) |
|
3 |
180 (11.1%) |
15 (0.1%) |
18.5 (27.4%) |
215 (12.7%) |
|
4 |
200 (4.7%) |
20 (0.0%) |
20.2 (7.9%) |
200 (10.9%) |
|
5 |
245 (6.6%) |
25 (0.1%) |
17.9 (16.6%) |
195 (7.2%) |
|
6 |
260 (5.5%) |
30 (0.0%) |
20.1 (15.7%) |
195 (9.3%) |
|
7 |
300 (6.1%) |
35 (0.0%) |
18.5 (20.3%) |
190 (7.1%) |
Elasticity modulus: 196 ± 20.3 GPa (15.8%)
Hardness: 18.9 ± 3.5 GPa (21.0 %)
Table 6. Sample #2. Measurement of hardness and elasticity modulus of a sample areas without film
|
Measurement Series No. |
Max. depth, nm |
Load, mN |
Hardness, GPa |
Elasticity modulus, GPa |
|
1 |
75 (3.2%) |
5 (0.2%) |
21.9 (5.5%) |
500 (9.6%) |
|
2 |
105 (7.5%) |
10 (0.1%) |
20.2 (12.1%) |
720 (8.5%) |
|
3 |
135 (10.4%) |
15 (0.1%) |
20.4 (18.5%) |
790 (17.3%) |
|
4 |
160 (4.6%) |
20 (0.1%) |
21.2 (12.0%) |
760 (11.6%) |
|
5 |
185 (5.1%) |
25 (0.0%) |
21.9 (8.6%) |
710 (16.7%) |
Elasticity modulus: 700 ± 125 GPa (17.5%)
Hardness: 21.5 ± 2.2 GPa (10.2 %)
In addition, the hardness was measured using NIOS Nanoscan scanning nanohardness tester by sclerometry — by scratching and analyzing the profile of the scratches from the image of the residual trace (see Appendix 3).
Table 7. Sample #1. Measurement of hardness of a sample areas with film
|
Measurement Series No. |
Load, mN |
Hardness, GPa |
|
1 |
20 |
35.5 (25.4%) |
|
2 |
30 |
29.3 (26.8%) |
|
3 |
40 |
30.7 (20.1%) |
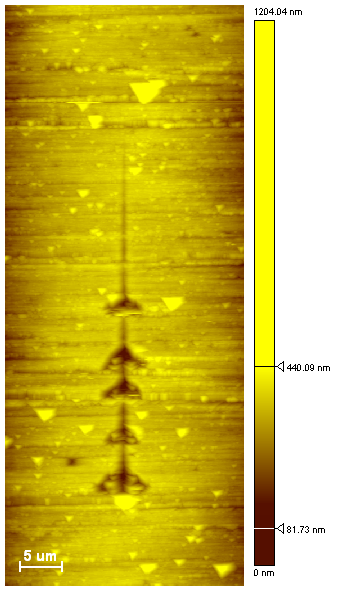 |
Fig.8. Sample #1. SPM image of the surface topography in the area with film after scratching with variable load: 200µN-60mN |
During scratching with a variable load of 200 μN to 60 mN, the film lifted off at a load of 30 mN.
The stiffness was measured using NIOS Nanoscan scanning nanohardness tester in the mode of measuring the dependence of loading - displacement (see Appendix 4).
Table 8. Sample #1. Drill stiffness measurement
|
Photo of a drill in a side-view USB videomicroscope |
Microscope drill photo |
Stiffness, kN/m |
|
|
|
2.15 (±2%) |
|
|
|
12.5 (±4.4%) |
Scanning nanoscale hardness testers NIOS Nanoscan allow you to obtain images of three-dimensional surface topography by scanning probe microscopy. Scanning is performed in tapping mode with a diamond tip mounted on a piezoceramic probe. The resonant oscillations of the probe occur with a frequency f ~ 10 kHz and with an amplitude A <50 nm. During the scanning process, the frequency For the amplitude A of the oscillations is kept constant.
In the frequency scanning mode, a constant stiffness of the indenter contact area with the surface is ensured. In this mode, it is recommended to study materials with relatively high values of hardness and elastic modulus (metals and alloys, crystalline materials, ceramics). In this case, the influence of the presence of contamination on the surface of the sample is eliminated or significantly reduced.
In the amplitude scanning mode, viscous contact of the probe with the surface is maintained constant, which allows one to study soft materials (polymers, plastics).
The size of the maximum scanning window is 100×100×10 μm.
The actual resolution achieved during scanning is limited by the radius of the contact spot of the tip with the surface and is of the order of 10 nm in the XY plane and not worse than 1 nm along the Z axis, which is typical for scanning force microscopes operating in air.

Fig.9. 3D image of the surface relief of polycrystalline SiC
|
Average Roughness, Ra |
Arithmetic mean deviation of the profile (average roughness, ISO 4287/1), nm.
The average deviation of all points of the roughness profile from the midline on the length of the assessment:
|
|
RMS (Root Mean Square), Rms |
Root mean square roughness (ISO 4287/1), nm.
The average value of the measured deviations from the midline on the length of the assessment:
|
|
Ten point height, Rz |
Rz=1/5*(Zmax1 + Zmax2 + Zmax3 + Zmax4 + Zmax5 - Zmin1 - Zmin2 - Zmin3 - Zmin4 - Zmin5), ten-point height (ISO 4287/1). The parameter expresses the surface roughness at the selected five highest and lowest points of the surface, nm |
On the basis of the NIOS Nanoscan, a method for measuring hardness is implemented, based on measuring and analyzing the dependence of the load when an indenter is pressed into the surface of the material on the indenter penetration depth. This method is the basis of the standard for measuring hardness ISO 14577.
For mechanical tests, an indenter of the Berkovich type is used, which is a trihedral diamond pyramid with an angle at the apex of about 142º.
The method of measuring dynamic indentation is as follows: the indenter is pressed into the surface of the sample at a constant speed, when the specified load is reached, the indenter is retracted in the opposite direction. During this test, the values of the load and the corresponding indenter displacement are recorded.
A typical experimental graph of the dependence of the load (P) on the indentation depth (h) is shown in Fig.10. It consists of two parts corresponding to the loading and unloading process. In the framework of this method, the hardness H of the sample is determined by the equation:

Here, Ac is the area of the fingerprint at the maximum value of the applied load Pmax.

Fig.10. The loading curve, and the contact diagram with values used in the methodology for calculating elasticity modulus and hardness
The value of the reduced modulus of elasticity is calculated as follows:

Here, the constant b depends on the shape of the indenter, and the stiffness of the contact S is determined by the angle of inclination of the tangent to the unloading curve at the point Pmax:

The contact area at maximum load Ac is determined by the indenter geometry and contact depth hc and is described by the so-called needle shape function:
![]()
Appendix 3. Sclerometry hardness measurement (scratching and analysis)
The hardness measurement using the NIOS Nanoscan sclerometry method consists in applying scratches to the surface of the material and scanning the resulting indents. Previously, the shape of the tip is calibrated on the reference material by applying a series of scratches at different loads. The value of the hardness of the material is calculated relative to the hardness of the standard by the ratio of the loads and the widths of the resulting scratches on the studied and reference materials (Fig.11).


Fig.11. Sclerometry hardness measurement
Scanning and surface modification is carried out with the same tip in one measurement cycle. This avoids the difficulty of finding scratches and indentations and significantly reduces the time spent on measurements.

|

|
| Fig.12. Membrane measurement scheme | Fig.13. Loading / unloading curve: segment of the free deflection of the membrane (a), abutment of the membrane in the substrate (b) |


 .
.
 .
.