-
Products
- Gas analysis systems
- GAOS SENSON gas analyzers
- GAOS MS process mass spectrometry
- MaOS HiSpec ion mobility spectrometer
- MaOS AxiSpec ion mobility spectrometer
- Applications
- News
- Events
- About us
The measuring procedure with the use of FTIR spectrometers IROS P series has been developed on the basis of the standard requirements for detection and determination of antioxidant content in insulating oils as set in GOST R IEEC 60666-2013 and ASTM D 2668-07(2013). Due to high scanning speed of the spectrometer, automation of spectral data measurement and processing processes, the sample analysis procedure is rapid and easy while the results of antioxidant content determination are characterized by high accuracy. Simple algorithms of calibration and measurements by additive method have been demonstrated; these algorithms may be implemented for field testing of power equipment conditions with the use of mobile FTIR spectrometers IROS P series.
Antioxidant content is one of the important quality indicators for monitoring of insulating oils condition. The antioxidant slows down the following processes: oxidation of mineral oils, deposit formation and increase in acidification. On-line analytical control and maintenance of antioxidant concentration in oils in the range between 0.25 and 0.4% wt. [1, 2] is a prerequisite for ensuring trouble-free operation and life time extension of power equipment: transformers, oil-filled switch gears and cables.
Phenol additives 2,6-di-tert-butyl paracresol (DBPC) and 2,6-di-tert-butyl phenol (DBP) are widely used as antioxidants for electrical insulating oils. Brand names of additives are: Agidol-1 (Ionol) and Agidol-2 accordingly. For the purpose of determining their content in fresh and pressure mineral oils, the Specifications for insulating oils used for transformers and switch gears [1] establish test methods with the use of Infrared (IR) spectrometry; these test methods are outlined in standards [3, 4].
This paper presents the measuring procedure intended for antioxidant qualitative and quantitative assays; this measuring procedure represents a modification of standards GOST R IEEC 60666 and ASTM D 2668 pertaining to the testing of insulation oils. The procedure includes sample preparation for testing, calibration sample preparation and calibration itself1. It may be used for field testing in the course of on-line monitoring of insulating oil condition.
Quantitative assays of DBPC & DBP additives are performed on the basis of IR absorption spectrum with 3,650 cm-1 maximum wavenumber that matches oscillating frequency of (О-Н)-bounds of phenolic compounds. To identify the type of antioxidant in the oil tested 860 cm-1 absorption lines are used for DBPC and 750 cm-1 absorption lines for DBP.
It may be difficult to determine additives (antioxidants) in the presence of oxygenate which cause a change in IR spectrum. In this case, it is essential to clean separate portions of pressure oil in order to remove antioxidants with the use of solid-phase extraction on silica gel as per the procedure described in standard [3] for the purpose of registering IR spectrum of base oil-free of additives; base oil-free of additives serves as the reference sample for the of considering spectral interferences.
Table 1 specifies basic metrological requirements for the measuring procedure.
Table
1. Basic metrological requirements for the measuring procedure
|
Parameter |
Value |
|
Measuring range of DBPC weight fraction, % |
0.02 - 0.5 |
|
Correlation factor of calibration graph, R2 |
> 0.99 |
|
Repeatability (reproducibility) of parallel measurements, % |
> 15 |
|
Parameter |
Value |
|
Cell path length, mm |
0.5 |
|
Spectral range, cm-1
|
400 - 4 000 |
|
Spectral resolution, cm-1
|
4 |
|
Number of scans |
20 |
|
Time duration of registration of IR transmission spectrum, sec |
< 90 |
acceptance inspection of calibration function built on the basis of unused mineral insulating oil for determination of DBPC content in samples of pressure oil in the presence of oxygenates and breakdown products;
development of measuring algorithm for DBPC determination in samples of pressure oil using the additive method.
Tests of insulating oil samples with DBPC antioxidants were conducted with the use of FTIR spectrometer IROS P01 manufactured by Ostec; the spectrometer was used complete with the demountable liquid cell and with the set of 0.1 – 0.8 mm brass inserts and windows made of KBr & CaF2.
FSpec basic software for IROS devices was used to exercise control over spectrometer’s operation and to register IR spectra. ASpec software was used for mathematical treatment of spectral data, calibration model generation and validation for determination of DBPC weight fraction in the insulating oils.
A glass syringe with 5 cm3 internal volume was used for filling sample into the cell and for its cleaning. Liquid cells were cleaned and rinsed by isopropyl alcohol. About 2 cm2 volume remained in the cell rinsed by the solvent after testing and before refilling it with a new sample for testing.
Calibration solutions in the range of DBPC weight fraction between 0.03% and 0.5% were prepared by gravimetric preparation and by antioxidant dissolving in the mineral oil. For acceptance inspection of calibration obtained the check samples with known DBPC concentration in the range between 0.1 and 0.5% weight fraction were prepared in a similar way with the use of spent electrical insulating oil-free of the antioxidant.
For the development of DBPC, determination procedure samples were prepared by mixing the pressure oil with an analyte of unknown concentration and the same pressure oil with the antioxidant added. While preparing mixtures, DBPC additive weight fraction in the range between 0.1 and 0.4 % in samples tested was determined with the help of a chemical balance.
Prior to taking measurement samples were mixed carefully in flasks by rotating them ‘upward-downward’ within 2-3 minutes for homogenization of the samples prepared; then the samples were held in a water bath at 50-60 °С for 30 minutes. While samples were held in the water bath, degassing (air bubble release from the mixture) was monitored.
Table 2 shows measurement parameters during IR transmission spectra registration.
For calibration model generation on the basis of unused mineral oil, each calibration solution was registered versus the base oil (reference sample) free of the antioxidant with the use of two cells of same path length – one cell was used for the calibration solution and the other for the reference sample. Such measuring algorithm makes it possible to obtain automatically IR transmission spectra with linear baseline, to consider interferences resulted from water absorption lines in the range between 3 600 and 3 700 cm-1. Sustainable measurement results and independence from environmental conditions were ensured by min. time interval between spectra registration of the reference sample and the sample tested.
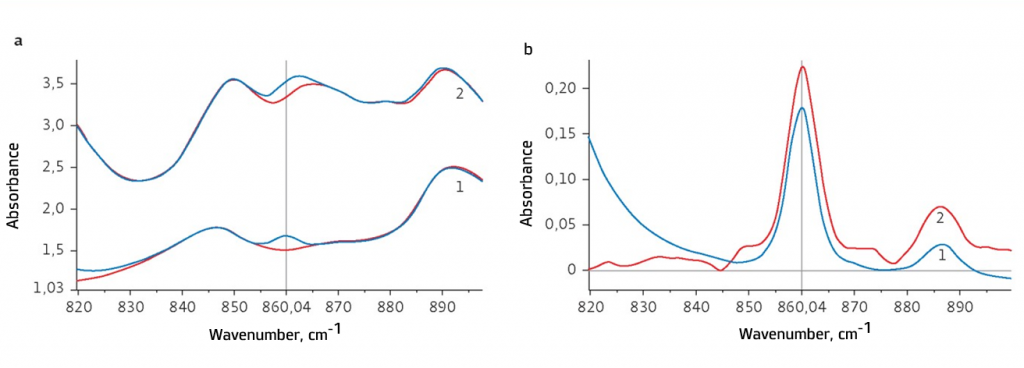
Fig. 1. DBPC qualitative assay on the basis of IR spectra in samples of unused (1) and oxygenated (2) insulating oils:
а – reference sample -atmospheric air, spectra for base oils are shown in red;
b – reference samples- base oils free of the antioxidant. DBPC weight fraction in insulating oil samples: 1 - 0.19%; 2 - 0.22%If a great number of tested samples is calibrated, the use of two cells for FTIR single-beam spectrometer IROS P01 is not of necessity, but worthy. In this case, there is a reduction in total time spent on taking measurements and there is a decrease in the risk of errors resulted from poor rinsing of the single cell.
For calibration model generation IR absorption spectra (optical density) were computed automatically in ASpec software for samples tested in the range between 3 600 and 3 700 cm-1 by the algorithm on the basis of Beer-Lambert absorption law:

where: A – optical density of DBPC quantitative assay in the oil; ADBPC+Oil – optical density of the oil-containing DBPC; AOil – optical density of the oil-free of DBPC (reference sample); I0, IOil, IDBPC+Oil – the intensity of incoming & transmitted radiation.
Fig.1а shows IR absorption spectra of samples of unused and oxygenated insulating oils registered relative to air in the range between 820 and 900 cm-1. DBPC content in samples was 0.19% & 0.22% of weight fraction accordingly.
Fig. 1b shows differential absorption spectra for the same samples taking into consideration the absorption spectra of base oils free of the antioxidant. This testing procedure of insulating oils is specified in ASTM D 2144 [5]. For the first sample, the pure mineral oil (from which calibration solutions were prepared) served as the reference sample; for the second sample, completely spent pressure oil-free of DBPC similar to the tested sample served as the reference sample.
Spectra shown in Fig. 1 are clear indication of the need for use of the reference sample for reliable determination of antioxidant (DBPC) as per the characteristic absorption band about 860 cm-1 in the pressure oil sample in the presence of oxygenates and breakdown products. The reference sample is required for registration of base oil IR spectrum and for calculation of optical density with the use of the equation (1).
Fig.2 shows IR absorption spectra in the range between 3 600 and 3 700 cm-1, obtained on the basis of the measuring algorithm described above for the pure mineral oil and calibration solutions with DBPC weight fraction from 0.03 to 0.5%. The optical density value was reduced to the optic layer thickness equal to 1.0 mm.
Peak height and peak area for the characteristic absorption band with max. of 3 651 cm-1 (for spectra presented in Fig. 2) were calculated automatically using ASpec software. The baseline was graduated forcibly as per two points: λ1 = 3 600 cm-1 and λ2 = 3 700 cm-1.
|
Fig. 2. IR absorption spectra of pure mineral oil and calibration solutions with DBPC weight fraction from 0.03 to 0.5% Fig. 3 shows calibration function graphs for determination of DBPC content in insulating oil on the basis of peak-height and peak-area. In both cases, the calibration results have met basic metrological requirements for the measuring procedure: the range of determination of DBPC weight fraction in the oil is 0.02 to 0.5%, correlation factor of calibration graph R2 is >0.99.
Relatively worse result of calibration on the basis of peak area versus calibration on the basis of peak height is due to strong impact of interferences nearby the baseline in the range between 3 600 and 3 700 cm-1. For obtaining more accurate results it is necessary to select best possible values of spectral resolution for measurement and L (λ1) & L (λ2) positions for the baseline determination.
Fig. 4 shows the result of the calibration model generation using the Conditional Least Squares (CLS) method with the help of ASpec software. |
Fig.3. Calibration function graphs for determination of DBPC content in oil: a - as per peak-height; b -as per peak-area
Fig. 4. Results of calibration model generation for determination of DBPC in oil using the Conditional Least Squares (CLS) with the help of ASpec software |
Table 3 shows the validation results by ‘spike (injected) /recovery (found)’ test of calibration models generated by three different methods. CLS demonstrates the best accuracy results in comparison with other methods of calibration on the basis of two criteria: correlation factor (R2) and bias between known concentration values and test results.
Table 4 shows the results of assessment of repeatability (reproducibility) of parallel measurements of DBPC content in the mineral oil nearby the low end of the measuring range; these results confirm accuracy indicators obtained during the calibration.
Table 3. Validation results by ‘spike/recovery’ test of calibration models generated by three different methods
DBPC concentration, % wt. |
||||||
|
Injected (spike), µi |
Calibration model |
|||||
|
Peak-height |
Peak-area |
CLS |
||||
|
Found (recovery) |
Deviation |
Found (recovery) |
Deviation |
Found (recovery) |
Deviation |
|
|
0.027 |
0.028 |
0.001 |
0.024 |
-0.003 |
0.027 |
0.0 |
|
0.058 |
0.061 |
0.003 |
0.060 |
0.002 |
0.060 |
0.002 |
|
0.089 |
0.089 |
0.0 |
0.084 |
-0.005 |
0.089 |
0.0 |
|
0.108 |
0.111 |
0.003 |
0.114 |
0.006 |
0.110 |
0.002 |
|
0.169 |
0.168 |
-0.001 |
0.162 |
-0.007 |
0.170 |
0.001 |
|
0.246 |
0.252 |
0.005 |
0.252 |
0.006 |
0.249 |
0.003 |
|
0.326 |
0.322 |
-0.004 |
0.314 |
-0.012 |
0.326 |
0.0 |
|
0.412 |
0.409 |
-0.003 |
0.415 |
0.003 |
0.407 |
-0.005 |
|
0.490 |
0.492 |
0.002 |
0.494 |
0.004 |
0.489 |
-0.001 |
|
S(yi-µi)2 |
7.4х10-5 |
3.3х10-4 |
4.4х10-5 |
|||
|
R2 |
0.9996 |
0.9985 |
0.9999 |
|||
|
Time duration of taking measurements |
СDBPC, % wt. |
Peak-to-peak amplitude, r |
||
|
Сi+1-Ci, % wt. |
2|Ci+1-Ci| (Ci+1+Ci) |
100, % |
||
|
13:31 |
0.0886 |
- |
- |
|
|
13:34 |
0.0878 |
-0.0008 |
0.9 |
|
|
13:37 |
0.0874 |
0.0004 |
0.5 |
|
|
13:40 |
0.0880 |
0.0006 |
0.7 |
|
|
13:43 |
0.0876 |
-0.0004 |
0.5 |
|
|
13:46 |
0.0881 |
0.0005 |
0.6 |
|
|
13:49 |
0.0878 |
-0.0003 |
0.3 |
|
|
13:52 |
0.0886 |
0.0008 |
0.9 |
|
|
Average value |
0.088±0.001 |
- |
- |
|
|
Maximum value |
- |
0.001 |
1 |
|
|
Limit value (k = 2) |
- |
0.002 |
2 |
|
|
Standard value [3, 4] |
- |
0.04 |
15 |
|
At the start of the test, the reference sample spectrum for the calibration solution with 0.089% weight fraction of the antioxidant was registered once. Time interval between parallel measurements was 3 minutes; it complied with the cycle time of single measurement including rinsing by solvent and refilling the cell with new sample for testing with automatic computation of DBPC concentration with the help of ASpec software.
For assessment of repeatability (reproducibility) of parallel measurements during long-term operation in accordance with this procedure, coverage factor of k=2 was selected for max. peak-to-peak amplitude, r, and for the whole sample collection; this factor corresponds to confidence coefficient Р=0.95.
The test results obtained in connection with result repeatability (reproducibility) of DBPC content in insulating oil have met the requirements of regulatory documents [3, 4]. The results of measuring accuracy assessment presented in Tables 3 & 4 permit it to conclude that random and systematic components of instrument error of the analytical set (consisting of FTIR spectrometer IROS P01 and of data processing system with FSpec/ASpec software and built-in CLS-calibration) is insignificant.
In practice methodological component of error (caused by difference in parameters of calibration model and the object under study (oil sample) which contains oxygenates and breakdown products) as well as operator’s errors during cell rinsing and filling it with samples are main sources of uncertainty during monitoring of insulating oil condition.
Table 5 shows the results of acceptance assessment of the calibration model generated by CLS method on the basis of unused mineral oil. Artificial mixtures were used as check samples, which were prepared by dissolving DBPC in completely spent insulating oil-free of the antioxidant. Max. deviation of the entire measuring range does not exceed ±0.03% of DBPC weight fraction; this value is a satisfactory result.
Calibration procedure described in standard [3] with the use of the pressure oil sample with the antioxidant removal (extraction) on silica gel is highly labor-intensive and requires appropriate laboratory equipment and materials: a rotary evaporator, a great number of special cartridges with silica gel and n-pentane (organic solvent).
Table 5. Results of acceptance inspection of the calibration model for determination of DBPC content in insulating pressure oil
|
Sample # |
DBPC concentration, % wt. |
||
|
Injected (spike), µi |
Found (recovery) |
Deviation |
|
|
1 |
0.10 |
0.11 |
-0.01 |
|
2 |
0.20 |
0.22 |
-0.02 |
|
3 |
0.30 |
0.29 |
0.01 |
|
4 |
0.40 |
0.38 |
0.02 |
|
5 |
0.50 |
0.47 |
0.03 |
There is an alternative additive method, that makes it possible to consider oxygenates and breakdown products as a part of the sample tested. To implement this method, pressure oil sample of volume about 120 cm3, antioxidant, analytical balance and chemical glassware are required.
The following algorithm of sample preparation with known DBPC content in two independent samples of insulation oil, ‘A’ and ‘B’, taken from different places (transformers), was used in this study: each sample tested was divided into two equal parts of 50 g; antioxidant aliquot (0.5 g) was dissolved in one part; then both parts of the sample (with unknown content and with DBPC additive) were mixed in equal proportion; proportion ratio was determined with the help of the analytical balance. Values of the additive weight fraction in samples СD were calculated as per the following formula:
![]() (2)
(2)
where C0 – additive weight fraction in the original sample; m1 – sample aliquot with unknown DBPC concentration ;m2 – aliquot of sample part with DBPC additive. Tables 6 and 7 show the results of calculation of DBPC weight fraction values of samples ‘A’ and ‘B’.
For the original oil samples and for samples obtained, IR transmission spectra relative to atmospheric air were registered with further calculation of absorption spectra (Fig. 5). Liquid cell with windows made of CaF2 and 0.5 mm path length was used for measurements. CaF2 ensures transparency in the range between 3 600 and 3 700 cm-1 for DBPC quantitative assay with the help of IR spectrometry and is more resistant to water vapors in comparison with KBr. In addition, there is no need for a desiccator during storage of CaF2 windows.
Table 6. DBPC weight fraction in original oil samples
|
Sample Name |
DBPC aliquot, g |
Sample aliquot, g |
Additive weight fraction in the original sample, C0, % wt. |
|
A |
0.530 |
55.607 |
0.953 |
|
B |
0.516 |
56.244 |
0.917 |
Table 7. DBPC weight fraction in samples
|
Sample # |
Sample aliquot with unknown DBPC concentration , m, g |
Aliquot of sample part with DBPC additive, m2, g |
Additive weight fraction in samples, СD, % wt. |
|
1A |
7.854 |
1.038 |
0.111 |
|
2A |
8.169 |
2.345 |
0.213 |
|
3A |
7.926 |
3.896 |
0.314 |
|
4A |
8.134 |
5.707 |
0.393 |
|
5B |
8.095 |
0.965 |
0.098 |
|
6B |
8.926 |
2.138 |
0.177 |
|
7B |
8.800 |
3.757 |
0.274 |
|
8B |
7.996 |
5.753 |
0.384 |
A new sample was injected into the cell by displacement method without rinsing the cell by the solvent. About 2 cm3 of sample was used to displace the old sample with a new one. This procedure makes it possible to simulate results of field quality tests of insulating oil and to assess the accuracy of DBPC determination by an operator without any special training.
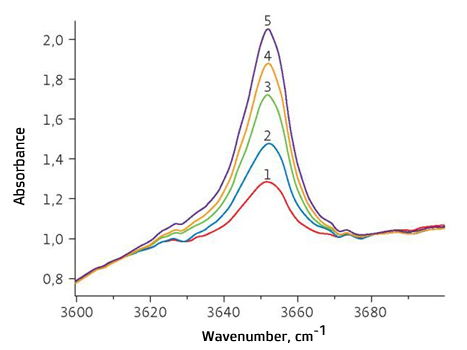
Fig. 5. IR absorption spectra of original sample ‘A’ of insulating oil (1) and samples prepared from sample ‘A’ with addition of the antioxidant. DBPC additive weight fraction: 2 – 0.11%; 3 – 0.21%; 4 – 0.31%; 5 – 0.39%
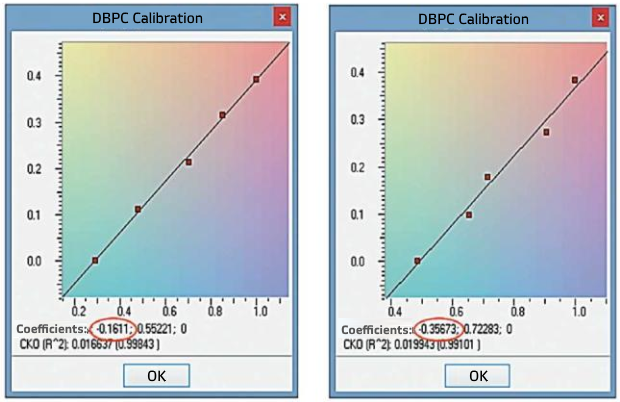
Using spectra obtained, calibration models of samples ‘A’ and ‘B’ were generated with the help of ASpec software on the basis of CLS method (see Fig. 6). The value of DBPC additive weight fraction in the sample was taken as the calibration standard concentration (Table 7). For calibration generation on the basis of CLS method spectral range of 3 625-3 675 cm-1 was set. Calibration curve in general is described by the following equation:
CD=aA+b, (3)
Absolute values of obtained coefficients ’b’ of calibration curve equations for samples ‘A’ and ‘B ‘equal to 0.161 and 0.357 correspond to unknown DBPC weight fractions in pressure oil samples tested (Fig. 6). Correlation factors of calibration graphs R2 in both cases exceed 0.99 despite of the simplified measuring algorithm.
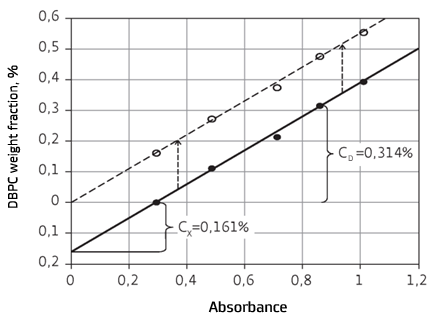
The main mathematical principle of the additive method for determination of unknown analyte concentration with the consideration of matrix impact is illustrated in Fig. 7 using sample ‘A’ as an example. The calibration curve may be generated if concentrations in samples are recalculated with the consideration of particular DBPC content in the sample tested; in this case, the calibration curve passes through the origin of coordinates and may be used for further monitoring of power equipment conditions
 |
|
|
a | b | |
|
Fig. 6. Results of calibration model generation for determination of DBPC in the oil-based on additive -diluting method: a - sample ‘А’; b - sample ‘В’. ASpec software, Conditional Least Squares (CLS). Factors of the calibration curve equation ‘remainder’ are marked in red |
Fig.7. Determination of DBPC in the sample ‘A’ of pressure insulating oil tested and calibration model generation (Y=0.552X-0.161) with the help of the additive method. Dashed line indicates the calibration model (Y=0.552X) obtained on the basis of the recalculation with the consideration of particular value of DBPC weight fraction in the sample of the oil tested | |
The
Conditional Least Squares (CLS) method makes it possible to reliably
approximate an analytical signal waveform irrespective of nature of base oil IR
spectrum, i.e. for the base oil quantitative assay; there is no need to
determine the linear baseline with the help of IR spectrum of the reference
sample corresponding to the matrix of sample tested. Fig. 8 shows the results of quantitative assay of sample ‘A’ IR
spectrum; there is a black color that represents approximation with the help of
CLS method. 0.16% value of DBPC weight fraction was determined with the help of the calibration obtained as the result of recalculation (Fig. 7).
Calibration models generated with the use of the additive method on five samples correspond to a minimum number of calibrations solutions as per the requirements of GOST R IEEC 60666. In practice in addition to the original sample two-three samples with known additive value is adequate for determination of the analyte concentration in the unknown sample for the purpose of considering or checking matrix impact on the results of measurements.
Tables 8 and 9 show the results of determination of DBPC weigh fraction (СХ) in samples ‘A’ and ‘В’ of pressure insulating oils when two different samples are used (n=2), with the assessment of relative deviation (d) from the value obtained for four samples with additives. In this case three points including samples themselves were used for determination of factors ‘a’ and ‘b’ of the equation of a straight line (3).
All
results of DBPC weight fraction in samples ‘A’ and ‘В’ with n=2 are within the
limits of allowable deviation of d<15% as established in standard [3], thus
representing the satisfactory result. With n=3, all results are under the
limits fixed; max. values of relative deviations for samples ‘A’ and ‘B’ are
10% and 11% accordingly. The algorithm suggested with the use of the additive
method may be used for on-line measurement quality control as well.
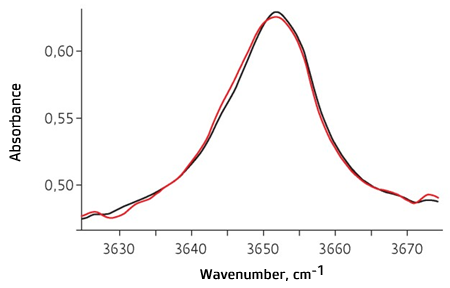
Fig. 8. IR absorption spectrum of the original sample ‘A’ of the insulating oil (red line) and approximation of spectrum on the basis of CLS method (black line)
Table 8. Determination of DBPC weight fraction in sample ‘A’ with the help of the additive method
Sample |
CD, % wt. |
Samples for determination of unknown concentrations |
|||||
|
Sample ‘A’ |
0.0 |
X |
X |
X |
X |
X |
X |
|
1А |
0.111 |
X |
X |
X |
- |
- |
- |
|
2А |
0.213 |
X |
- |
- |
X |
- |
X |
|
3А |
0.314 |
- |
X |
- |
X |
X |
- |
|
4А |
0.393 |
- |
- |
X |
- |
X |
X |
|
СХ, % wt. |
0.161 |
0.145 |
0.161 |
0.158 |
0.164 |
0.162 |
0.165 |
|
d, % |
- |
10 |
0 |
1.9 |
1.9 |
0.6 |
2.5 |
Table 9. Determination of DBPC weight fraction in sample ‘В’ with the help of the additive method
Sample |
CD, % wt. |
Samples for determination of unknown concentrations |
|||||
|
Sample ‘В’ |
0.0 |
X |
X |
X |
X |
X |
X |
|
5В |
0.098 |
X |
X |
X |
- |
- |
- |
|
6В |
0.177 |
X |
- |
- |
X |
- |
X |
|
7В |
0.274 |
- |
X |
- |
X |
X |
- |
|
8В |
0.384 |
- |
- |
X |
- |
X |
X |
|
СХ, % wt. |
0.357 |
0.358 |
0.321 |
0.379 |
0.308 |
0.351 |
0.358 |
|
d, % |
- |
0.3 |
10 |
6.2 |
14 |
1.7 |
0.3 |
The procedure pertaining to DBPC determination in insulating oil on the basis of the additive method has been developed; this additive method excludes the necessity for applying base oils or labor-intensive procedure of antioxidant removal from pressure oil sample. FSpec/ASpec software used in FTIR spectrometers IROS P01 makes it possible to compute automatically unknown antioxidant concentrations on the basis of the additive method and to generate calibration models on the basis of solutions prepared from the pressure oil sample tested.
Calibration and measuring algorithms for antioxidant determination, developed in addition to standards GOST R IEEC 60666 and ASTM D 2668, comply with the current trends pertaining to building of systems for monitoring of industrial equipment condition on the basis of chemical composition of process medium. Their advantages are specified below: efficient delivery of results, absence of complicated and labor-intensive procedures for sample preparation, automation of measurements and calculations. A major benefit of the procedure developed makes it possible to conduct tests by operators without any special training directly on-site near the testing object.
The measuring procedure of antioxidant content on the basis of FTIR spectrometer IROS P01 and FSpec/ASpec software may be used for other types of mineral oils: turbine, compressor, hydraulic and crankcase oils.
[2] ASTM D 3487-16e1. Specification for Mineral-Insulating Oil Used in Electrical Apparatus. ASTM International. URL: www.astm.org
[3] GOST R IEEC 60666-2013. Mineral insulating oils. Detection and determination of specified additives. M.: Standartinform, 2014. 28 p.
[4] ASTM D 2668-07(2013). Standard Test Method for 2,6-di-tert-Butyl-p-Cresol and 2,6-di-tert-Butyl Phenol in Electrical Insulating Oil by Infrared Absorption. ASTM International. URL: www.astm.org
[5] ASTM D 2144-07(2013). Standard Test Methods for Examination of Electrical Insulating Oils by Infrared Absorption. ASTM International. URL: www.astm.org